

G20 GDP growth slows to 0.8% in the first quarter of 2025
Gross domestic product (GDP) in the G20 area rose by 0.8% in the first quarter of 2025, slightly down from 0.9% in the previous quarter, according to provisional estimates (Figure 1). However, the picture was mixed among G20 countries.
In Korea and the United States, GDP contracted, by respectively 0.2% and 0.1%, in Q1 2025, following growth of 0.1% and 0.6% in the previous quarter. Growth slowed sharply in Türkiye and Japan, dropping from 1.7% to 1.0% and from 0.6% to 0.0%, respectively, while more moderate slowdowns were observed in China (from 1.6% to 1.2%), Australia (from 0.6% to 0.2%), South Africa (from 0.4% to 0.1%), and Indonesia (from 1.2% to 1.1%). Growth remained stable in Canada at 0.5%.
Conversely, the remaining G20 countries experienced higher growth in Q1 2025 compared to the previous quarter. Brazil recorded a substantial acceleration, with growth rising from 0.1% to 1.4%, while the United Kingdom saw a notable improvement, with GDP growth increasing from 0.1% to 0.7%. Growth improved marginally in Saudi Arabia (from 0.9% to 1.1%), India (from 1.9% to 2.0%) and Italy (from 0.2% to 0.3%), while growth rebounded in Mexico (from -0.7% to 0.2%), Germany (from -0.2% to 0.4%), and France (from -0.1% to 0.1%).
Compared with the same quarter of the previous year, GDP in the G20 area was 3.4% higher in Q1 2025, the same growth as in the previous quarter (Table 2). Among G20 economies, India recorded the highest year-on-year growth rate at 6.9%, followed by China (5.4%) and Indonesia (4.8%). Korea recorded the largest contraction at -0.3%.
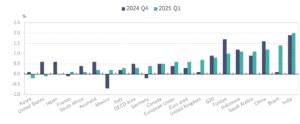
Figure 1 – Gross domestic product (quarter-on-quarter change)
Percentage change on the previous quarter, seasonally adjusted data
* Japan recorded zero growth in Q1-2025.
Table 1 – Quarterly (quarter-on-quarter) real GDP growth
Percentage change on the previous quarter, seasonally adjusted data
| 2023 | 2024 | 2025 | |||||||
| Q1 | Q2 | Q3 | Q4 | Q1 | Q2 | Q3 | Q4 | Q1 | |
| G20 | 1.0 | 1.0 | 0.8 | 0.6 | 0.8 | 0.7 | 0.9 | 0.9 | 0.8 |
| Argentina | 1.8 | -2.9 | 2.0 | -2.3 | -1.4 | -1.7 | 4.3 | 1.4 | .. |
| Australia | 0.5 | 0.4 | 0.5 | 0.1 | 0.1 | 0.2 | 0.3 | 0.6 | 0.2 |
| Brazil | 1.4 | 0.8 | 0.1 | 0.3 | 1.0 | 1.5 | 0.8 | 0.1 | 1.4 |
| Canada | 1.4 | 0.1 | -0.2 | 0.0 | 0.2 | 0.6 | 0.6 | 0.5 | 0.5 |
| China | 1.6 | 1.3 | 1.5 | 0.9 | 1.3 | 1.0 | 1.4 | 1.6 | 1.2 |
| France | 0.1 | 0.9 | 0.2 | 0.4 | 0.1 | 0.2 | 0.4 | -0.1 | 0.1 |
| Germany | 0.1 | -0.2 | 0.2 | -0.4 | 0.2 | -0.3 | 0.1 | -0.2 | 0.4 |
| India | 2.6 | 2.9 | 2.1 | 1.8 | 1.4 | 1.3 | 1.5 | 1.9 | 2.0 |
| Indonesia | 1.2 | 1.3 | 1.3 | 1.2 | 1.3 | 1.2 | 1.2 | 1.2 | 1.1 |
| Italy | 0.5 | -0.2 | 0.1 | 0.2 | 0.2 | 0.2 | 0.0 | 0.2 | 0.3 |
| Japan | 1.2 | 0.6 | -1.0 | -0.1 | -0.3 | 1.0 | 0.2 | 0.6 | 0.0 |
| Korea | 0.4 | 0.7 | 0.8 | 0.5 | 1.2 | -0.2 | 0.1 | 0.1 | -0.2 |
| Mexico | 0.8 | 0.8 | 0.5 | 0.4 | 0.0 | 0.2 | 0.8 | -0.7 | 0.2 |
| Russian Federation | |||||||||
| Saudi Arabia | 0.4 | -0.6 | -2.8 | 0.3 | 2.2 | 1.0 | 0.3 | 0.9 | 1.1 |
| South Africa | 0.7 | 0.8 | -0.4 | 0.4 | 0.1 | 0.3 | -0.3 | 0.4 | 0.1 |
| Türkiye | 0.1 | 4.0 | 0.2 | 1.2 | 1.0 | -0.2 | -0.1 | 1.7 | 1.0 |
| United Kingdom | 0.1 | 0.0 | -0.1 | -0.2 | 0.9 | 0.5 | 0.0 | 0.1 | 0.7 |
| United States | 0.7 | 0.6 | 1.1 | 0.8 | 0.4 | 0.7 | 0.8 | 0.6 | -0.1 |
| European Union | 0.1 | 0.1 | 0.2 | 0.1 | 0.3 | 0.3 | 0.4 | 0.4 | 0.6 |
| of which: Euro area | 0.0 | 0.2 | 0.0 | 0.1 | 0.3 | 0.2 | 0.4 | 0.3 | 0.6 |
| OECD area | 0.5 | 0.5 | 0.4 | 0.3 | 0.4 | 0.5 | 0.5 | 0.5 | 0.3 |
..: not available
Note: The Russian Federation is included in the G20 estimates, but it is not shown separately. From Q4 2021, GDP figures for Russia are not included, as reliable estimates are not available, and the G20 totals are reweighted accordingly.
Source: OECD (2025) Quarterly National Accounts (Database)
Table 2 – Quarterly (year-on-year) real GDP growth
Percentage change on the same quarter of the previous year, seasonally adjusted data
| 2023 | 2024 | 2025 | |||||||
| Q1 | Q2 | Q3 | Q4 | Q1 | Q2 | Q3 | Q4 | Q1 | |
| G20 | 3.3 | 3.9 | 3.3 | 3.5 | 3.2 | 3.0 | 3.1 | 3.4 | 3.4 |
| Argentina | 0.4 | -3.8 | -1.5 | -1.5 | -4.6 | -3.4 | -1.3 | 2.5 | .. |
| Australia | 2.7 | 2.0 | 2.1 | 1.5 | 1.2 | 0.9 | 0.8 | 1.3 | 1.3 |
| Brazil | 4.0 | 3.7 | 2.7 | 2.6 | 2.1 | 2.8 | 3.5 | 3.3 | 3.8 |
| Canada | 2.8 | 1.9 | 1.1 | 1.2 | 0.1 | 0.5 | 1.4 | 1.9 | 2.3 |
| China | 4.7 | 6.5 | 5.0 | 5.3 | 5.3 | 4.7 | 4.6 | 5.4 | 5.4 |
| France | 1.4 | 1.9 | 1.6 | 1.7 | 1.7 | 1.0 | 1.1 | 0.6 | 0.6 |
| Germany | 0.2 | 0.1 | -0.3 | -0.2 | -0.1 | -0.2 | -0.3 | -0.2 | 0.0 |
| India | 7.2 | 9.4 | 9.3 | 9.7 | 8.4 | 6.7 | 6.2 | 6.2 | 6.9 |
| Indonesia | 4.9 | 5.0 | 5.2 | 5.1 | 5.2 | 5.1 | 5.0 | 4.9 | 4.8 |
| Italy | 2.1 | 0.4 | 0.2 | 0.6 | 0.3 | 0.7 | 0.6 | 0.6 | 0.7 |
| Japan | 2.2 | 1.7 | 1.0 | 0.7 | -0.9 | -0.5 | 0.7 | 1.4 | 1.7 |
| Korea | 1.4 | 1.2 | 1.5 | 2.3 | 3.2 | 2.2 | 1.5 | 1.1 | -0.3 |
| Mexico | 3.9 | 3.6 | 3.5 | 2.5 | 1.8 | 1.2 | 1.5 | 0.4 | 0.6 |
| Russian Federation | |||||||||
| Saudi Arabia | 5.7 | 2.3 | -2.8 | -2.7 | -0.9 | 0.6 | 3.9 | 4.5 | 3.3 |
| South Africa | 0.2 | 1.9 | -0.3 | 1.5 | 0.9 | 0.3 | 0.4 | 0.5 | 0.5 |
| Türkiye | 3.2 | 5.9 | 5.6 | 5.6 | 6.5 | 2.2 | 1.9 | 2.4 | 2.4 |
| United Kingdom | 0.8 | 0.5 | 0.4 | -0.2 | 0.7 | 1.1 | 1.2 | 1.5 | 1.3 |
| United States | 2.3 | 2.8 | 3.2 | 3.2 | 2.9 | 3.0 | 2.7 | 2.5 | 2.1 |
| European Union | 1.3 | 0.6 | 0.3 | 0.4 | 0.6 | 0.8 | 1.0 | 1.4 | 1.6 |
| of which: Euro area | 1.5 | 0.7 | 0.1 | 0.2 | 0.5 | 0.6 | 0.9 | 1.2 | 1.5 |
| OECD area | 1.9 | 1.9 | 1.8 | 1.8 | 1.7 | 1.7 | 1.7 | 1.9 | 1.7 |
..: not available
Note: The Russian Federation is included in the G20 estimates, but it is not shown separately. From Q4 2021, GDP figures for Russia are not included, as reliable estimates are not available, and the G20 totals are reweighted accordingly.
Source: OECD (2025) Quarterly National Accounts (Database)