Footfall slips back from Omicron impact
Covering the four weeks 28 November 2021 – 1 January 2022
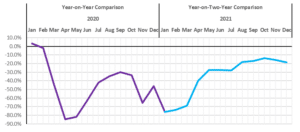
2020 was a turbulent year in which much of retail bounced between being open and closed, impacting footfall significantly. To make meaningful comparisons to changes in footfall, all 2021 figures are compared with 2019 (pre-pandemic). This means our 2021 figures are now year-on-two-years (Yo2Y), rather than year-on-year (YoY).
According to BRC-Sensormatic IQ data:
- Total UK footfall decreased by 18.6% in December (Yo2Y), with a 2.9 percentage point decrease from October. This is below the 3-month average decline of 16.4%.
- This was ahead of France (-23.5%), Spain (-25.2%), Italy (-37.0%) and Germany (-51.5%) in December (Yo2Y).
- Footfall on high streets declined by 23.1% in December (Yo2Y), 3.5 percentage points below last month’s rate and below the 3-month average decline of 20.7%.
- Retail parks saw footfall decrease by 9.2% (Yo2Y), 5.1 percentage points below last month’s rate and below the 3-month average decline of 5.1%.
- Shopping centre footfall declined by 36.6% (Yo2Y), 1.8 percentage points below last month’s rate and below the 3-month average decline of 34.6%.
- Northern Ireland again saw the shallowest footfall decline out of the four nations at -10.8% (Yo2Y), followed by Wales at -20.1% and England at -20.2%. For the fifth consecutive month, Scotland saw the deepest decline at -22.8% (Yo2Y).
- For the whole of 2021, Total UK footfall was -33.2% (Yo2Y) below pre-pandemic levels, however this was up 19.3% (YoY) on 2020.
Helen Dickinson OBE, chief-executive of British Retail Consortium, said: “Much of the progress made over the last four months was wiped out in December as surging Omicron cases and new work-from-home advice deterred many from shopping in-store, particularly in towns and city centres. As case numbers rose precipitously, many people chose to limit social mixing in the run up to Christmas and shop less frequently. Nevertheless, while UK footfall saw a moderate decline compared to previous months, it remained above levels of other major European economies, as the country avoided some of the more severe restrictions implemented elsewhere.
“December footfall capped a challenging year for brick-and-mortar stores, which saw footfall down one-third on pre-pandemic levels, though this was a significant improvement on 2020. With Christmas out the way, time will tell if shoppers return to their local high streets to embrace January sales and the arrival of spring collections. Still, retailers may have to work twice as hard to tempt many consumers back into the cold this January.”
Andy Sumpter, retail consultant EMEA for Sensormatic Solutions, commented: “While there weren’t any formal government restrictions, aside from the Plan B mask-wearing mandate, placed on retailers in December, concerns about the rapid spread of Omicron dealt a blow to shopper confidence, as consumers self-policed social contacts and limited shopping trips in a bid to save their own Christmases. But this will have done little to save the Christmases of retail businesses, effectively stalling the High Street’s recovery in the run up to their most important trading period, with shopper counts across all retail settings receding to the levels seen in August, wiping away the slow but steady footfall recovery and gains we had seen up until the start of November.”
“With the booster vaccination programme being delivered at pace and some glimmers of hope that the Omicron wave maybe plateauing in some regions, retailers will be hoping that consumers’ cautious optimism returns, and with that a new year’s resolve to continue to support local High Streets and bricks-and-mortar stores.”
MONTHLY TOTAL UK RETAIL FOOTFALL (% CHANGE WITH 2019)

UK FOOTFALL BY LOCATION (% CHANGE WITH 2019)

TOTAL FOOTFALL BY REGION (% CHANGE WITH 2019, YO2Y)
| GROWTH RANK | REGION | % GROWTH Yo2Y |
| 1 | Northern Ireland | -10.8% |
| 2 | North West England | -14.4% |
| 3 | West Midlands | -16.9% |
| 4 | South West England | -17.2% |
| 5 | Yorkshire and the Humber | -17.8% |
| 6 | East of England | -19.1% |
| 7 | East Midlands | -19.3% |
| 8 | South East England | -19.7% |
| 9 | North East England | -19.9% |
| 10 | Wales | -20.1% |
| 11 | England | -20.2% |
| 12 | Scotland | -22.8% |
| 13 | London | -28.1% |
TOTAL FOOTFALL BY CITY (% CHANGE WITH 2019, YO2Y)
| GROWTH RANK | CITY | % GROWTH Yo2Y |
| 1 | Belfast | -0.6% |
| 2 | Liverpool | -11.2% |
| 3 | Manchester | -12.9% |
| 4 | Cardiff | -15.9% |
| 5 | Portsmouth | -16.3% |
| 6 | Bristol | -17.7% |
| 7 | Leeds | -18.6% |
| 8 | Birmingham | -19.7% |
| 9 | Glasgow | -21.8% |
| 10 | Nottingham | -23.8% |
| 11 | London | -26.7% |

