How to trade currencies using Bollinger bands
Technical analysis is studying past price movements that allow you to forecast future changes to an exchange rate. Several popular studies can help you achieve this goal. One of the most effective strategies is the Bollinger band strategy created by John Bollinger. This strategy is a volatility based system that relies on the standard deviation, which changes as volatility increases and decreases.
What are Bollinger bands
Bollinger bands create a range for where an exchange rate has traded over a certain period. The middle of the spectrum is a moving average. The default recommended by John Bollinger is the 20-period moving average. The upper end of the range is a standard deviation above the middle of the spectrum. The lower end of the range is a standard deviation below the average of the spectrum. John Bollinger recommends using a 2-standard deviation volatility calculation to create the upper end of the spectrum and the lower end range.
 How to trade using Bollinger bands
There are two ways that traders often use Bollinger bands to trade. The most common is to use a mean-reverting technique. This methodology is where traders sell a currency pair when the exchange rate rises above the Bollinger band upper bound. This strategy works well when a currency pair is moving sideways and consolidating.
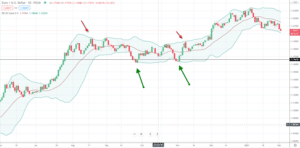
From the EUR/USD forex chart, you can see that a mean reversion strategy was advantageous when the exchange rate moved sideways from August 2020 to December of 2020. You can see that when the exchange rate crossed below the Bollinger band, low would lead to profitable trade as the EUR/USD exchange rate reverted to the 20-day moving average. The same thing occurred when the exchange rate hit the Bollinger band high. The exchange rate reverted to the mean.
Using risk management
What is also evident is that when volatility picks up a close above the Bollinger band high can also lead to a breakout. Since that can happen, it is prudent to use risk management techniques or a confirmation indicator to ensure that the market is poised to mean revert.
Here are two confirmation techniques you can use. The first is to ensure that when the exchange rate crosses above the Bollinger band high, it does not close there. If there is a false breakout, you can be more confident that the exchange rate will revert. If the exchange rate closes above the Bollinger band high, you can wait for it to close back below that level as a confirmation of mean reversion. You can use the same confirmation when the exchange rate moves or closes below the Bollinger band low.
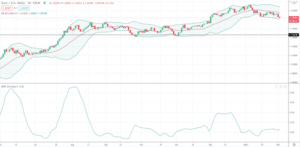
 Another technique you can use is to evaluate volatility to determine if a price is breaking out or poised to mean revert. As the Bollinger band high moves toward the Bollinger band low, volatility is contracting. As the Bollinger band high moves away from the Bollinger band, low volatility is rising. One way to determine if the Bolliger bands are contracting or expanding is to look at the Bollinger bandwidth. When the Bollinger bandwidth is rising, volatility is rising. When the Bollinger bandwidth is falling or moving sideways, volatility is low and contained. You want to avoid using a mean reversion strategy when volatility is rising and breaking out and the exchange rate closes above the Bollinger band high or close below the Bollinger band low.
The bottom line
Bollinger bands are a volatility based study that can be used to trade the currency markets. Trader’s use these bands to develop a mean-reverting strategy. When the exchange rate rises to the upper band, a sell signal might occur. When the exchange rate dips to the lower band, a buy signal might occur. You should consider using confirmation indicators to help you determine if a mean reversion will take place or the exchange rate is poised to break out.

