

Kickstarter campaigns from UK are second most successful in the world!
The experts at Forbes Advisor sought to find out the factors successful Kickstarter projects have in common, from the country of origin to the type of business itself. This was achieved with an analysis of over a decade’s worth of data on Kickstarter – equating to around 350,000 crowdfunding campaigns (listed on Kickstarter from 2010 – 2022).
To view the full dataset, which shows detailed information on each category and subcategory of the Kickstarter included in the study, please click here.
Key findings:
– Kickstarter campaigns related to ‘Comics’ (raising money for comic book and graphic novel creations) are most likely to succeed, with 64% of them reaching their funding targets.
– ‘Games’ related campaigns raised the most money on Kickstarter—£1.61bn between 2010–2022.
– Japan is the country with the highest percentage of successful Kickstarter campaigns, followed by the United Kingdom and the United States.
These are the most and least successful Kickstarter campaign types
| Category | Sample Size | Average Funding Ratio | Average Number of Backers | Total Raised £ (between 2010–2022) | Average Raised | Success Rate |
| Comics | 17735 | 147% | 107 | £150,523,932 | £3,566.71 | 64% |
| Dance | 3622 | 92% | 39 | £13,157,699 | £2,498.69 | 61% |
| Theatre | 8468 | 90% | 35 | £40,847,531 | £2,150.42 | 60% |
| Music | 40566 | 79% | 42 | £230,008,311 | £2,392.49 | 50% |
| Art | 36723 | 96% | 30 | £151,162,685 | £1,324.23 | 48% |
| Games | 38674 | 208% | 190 | £1,617,475,100 | £7,616.90 | 45% |
| Design | 23854 | 182% | 133 | £1,223,582,200 | £10,758.86 | 41% |
| Film & Video | 45231 | 68% | 38 | £443,416,231 | £3,046.19 | 38% |
| Publishing | 33854 | 80% | 48 | £244,757,580 | £2,357.23 | 36% |
| Photography | 9182 | 66% | 31 | £48,646,480 | £1,955.60 | 34% |
| Fashion | 23612 | 74% | 34 | £187,345,515 | £2,243.07 | 30% |
| Crafts | 8954 | 59% | 15 | £20,765,887 | £664.31 | 27% |
| Food | 22925 | 39% | 31 | £162,479,587 | £2,380.28 | 26% |
| Journalism | 5740 | 25% | 12 | £16,894,593 | £602.83 | 23% |
| Technology | 37557 | 42% | 41 | £1,047,012,500 | £4,137.02 | 22% |
After analysing 350,000 crowdfunding campaigns listed on Kickstarter between 2010–2022, Forbes Advisor can reveal that the category with the highest success rate is ‘Comics’ (64%). The ‘Comics’ category on Kickstarter included campaigns such as the creation of comic books, graphic novels, webcomics, anthologies (collections of poems or other pieces of writing), and organising events related to the above. The success rate is determined by the percentage of campaigns that reached their funding targets.
In second place are ‘Dance’ Kickstarters, with 61% of them reaching their funding targets. The projects found under the ‘Dance’ campaign section raised money to organise performances, hire dance spaces and put on dancing workshops.
‘Theatre’ comes in third place with 60% of campaigns achieving their funding targets, followed by ‘Music’ (50%) and ‘Art’ (48%).
The data over the past 12 years has shown that ‘Technology’ is the category with the lowest chance of reaching its funding targets with only 22% of campaigns successful.
For examples of all types of projects and events each category is raising money for please see here.
What categories raised the most money on Kickstarter
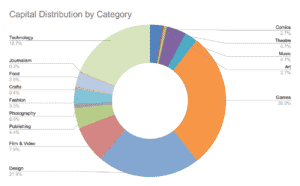
The Kickstarter campaign type that has raised the most money from 2010 to 2022 is ‘Games’, with the gaming industry raising a whopping £1.61bn for their projects—however, only 45% of gaming-related campaigns hit their funding targets. The ‘games’ category on Kickstarter includes people and projects that are creating gaming hardware, live games, mobile games, puzzles, tabletop games, and video games. With statistics from the game development company Aurochdigital stating that the average cost for creating an indie game is £335,064, perhaps it’s unsurprising that less than half of ‘Game’ Kickstarters met their funding targets.
Campaign types that are in the ‘Design’ category raised the second most funds, with £1.22bn raised over the past 12 years.
Although considered the least successful Kickstarter campaign type when it comes to reaching funding targets (22%), ‘Technology’ campaigns have raised £1bn in total for their projects.
These are the countries with the most and least successful Kickstarter campaigns
| Country | Sample Size | Average Funding Ratio | Average Number of Backers | Average Raised | Success Rate |
| Japan | 1,754 | 171% | 95 | £6,825 | 63% |
| United Kingdom | 36,267 | 102% | 48 | £2,440 | 56% |
| United States | 240,234 | 79% | 52 | £3,066 | 55% |
| Singapore | 1,633 | 126% | 57 | £3,458 | 55% |
| France | 5,218 | 93% | 56 | £3,776 | 51% |
| Denmark | 1,497 | 85% | 53 | £3,442 | 51% |
| Sweden | 2,415 | 87% | 66 | £3,801 | 49% |
| Canada | 16,065 | 90% | 49 | £2,479 | 49% |
| New Zealand | 1,491 | 84% | 49 | £2,494 | 49% |
| Australia | 8,041 | 79% | 42 | £2,061 | 45% |
| Ireland | 1,063 | 64% | 44 | £2,290 | 44% |
| Germany | 6,346 | 78% | 46 | £3,125 | 44% |
| Spain | 4,473 | 85% | 47 | £2,633 | 44% |
| Switzerland | 1,239 | 68% | 44 | £5,653 | 42% |
| Netherlands | 2,940 | 68% | 41 | £2,761 | 41% |
| Italy | 5,085 | 57% | 31 | £1,870 | 34% |
| Mexico | 4,998 | 40% | 16 | £662 | 32% |
The data reveals that the country with the highest percentage of successful Kickstarters is Japan, with a whopping 63% of campaigns reaching their funding targets.
The second most successful country when it comes to campaigning on Kickstarter is the United Kingdom, with 56% of campaigns reaching their funding targets, followed by the United States with 55%.
At the other end of the spectrum, Mexico is the country with the lowest success rate—only 32% of campaigns hit their original target.
Italy and Netherlands can be found at the bottom of the list as well with a success rate of only 34% and 41% respectively.
Methodology:
- Forbes Advisor conducted an analysis of over 350,000 crowdfunding campaigns listed on Kickstarter between 2010 – 2022 to uncover factors that influence funding success assessing metrics such as funding ratios, success rates, and capital distribution across industries and countries.
- Raw monthly snapshots of project listings on Kickstarter were collected from Web Robots resulting in a sample of over 350,000 unique campaigns listed globally between 2010 – 2022 across 15 categories and over 100 subcategories.
- Proceeding JSON normalisation, data deduplication and dollar denomination of campaigns in the sample, the funding ratio was calculated as the percentage difference between a project’s monetary goal and the funds raised.
- The sample was subsequently aggregated to produce multiple tables describing the average funding ratio, average backer count, average capital raised and success rates across categories, subcategories, countries and years.
- Updated metrics for total funds raised and success rates by category provided on Kickstarter stats were used. Countries with a sample smaller than 1000 campaigns were omitted along with Hong Kong which is not a recognised sovereign state under the United Nations.